Product-Market Fit Survey: The Founder's 2026 Guide
Product-Market Fit Survey: The Founder’s 2026 Guide

A product-market fit survey is defined as a structured measurement of how indispensable your product is to your customers, not just how satisfied they are with it. The most recognized method, developed by Sean Ellis, asks users one core question: “How would you feel if you could no longer use this product?” Products that score 40% or more “very disappointed” responses demonstrate strong product-market fit. That single benchmark has guided thousands of startups in determining product-market fit before committing to growth spend. This guide covers the full process: how the survey works, how to design it well, how to read the results, and what to do next.
What is the Sean Ellis product-market fit survey?
The Sean Ellis survey is the most widely used tool for measuring product-market fit. It centers on one question: “How would you feel if you could no longer use [product]?” Respondents choose from four options: “Very disappointed,” “Somewhat disappointed,” “Not disappointed,” and “N/A, I no longer use it.” Your PMF score is the percentage of respondents who answer “Very disappointed.”
The 40% benchmark is the standard threshold for strong product-market fit. Scores between 25% and 40% indicate emerging fit. Scores below 25% signal weak fit and suggest the product needs significant changes before scaling. These ranges give founders a clear, repeatable signal rather than a gut feeling.

The reason this question predicts retention better than satisfaction scores or Net Promoter Score is dependency. A product can score well on satisfaction while users still feel no real loss if it disappears. High satisfaction but low PMF means users like the product but do not need it. That distinction matters enormously when you are deciding whether to scale.
The 40% threshold should be treated as a lagging indicator within a broader measurement system. Reaching 40% is not a license to scale without checking churn rates, acquisition costs, and retention trends. Think of it as a green light that requires confirmation from behavioral data before you accelerate.
Key PMF score ranges at a glance:
- Above 40%: Strong product-market fit. Focus on retention and growth.
- 25–40%: Emerging fit. Strengthen your value proposition and narrow your ideal customer profile.
- Below 25%: Weak fit. Reassess problem-solution fit before any scaling effort.
How to design an effective product-market fit survey
Survey design determines whether you get signal or noise. A poorly structured survey with the wrong respondents will produce data that misleads your roadmap decisions. The goal is a short, focused instrument that captures both a quantitative score and the qualitative reasoning behind it.
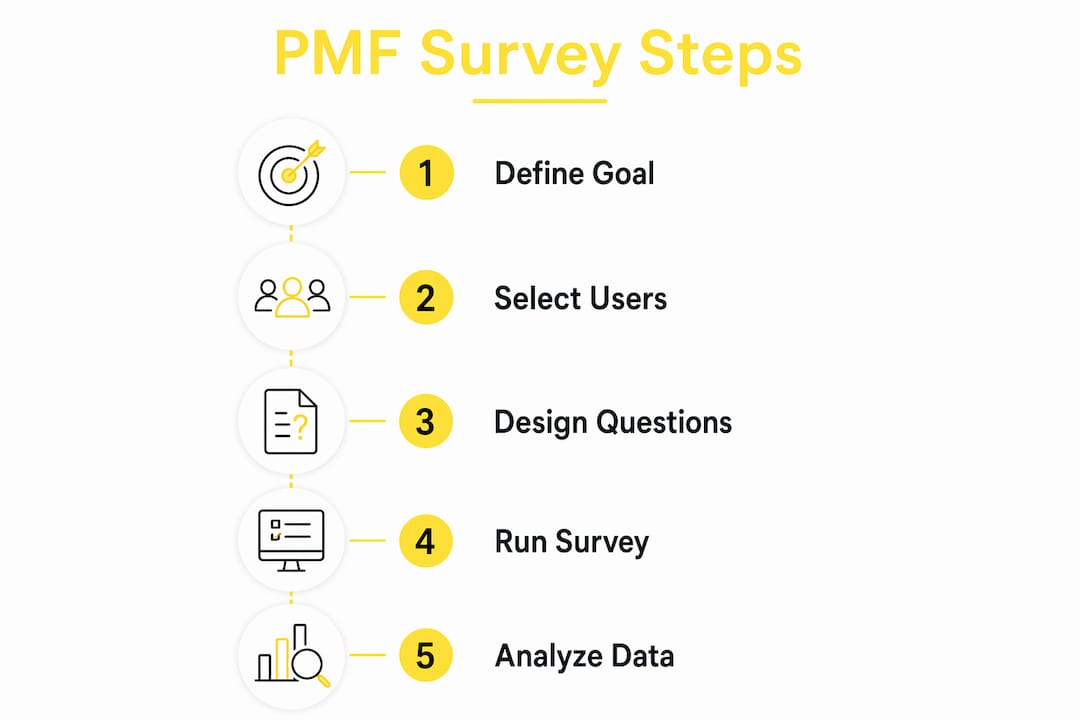
Follow these steps to build a survey that works:
-
Lead with the core question. Place the “very disappointed” question first. Embedding it first prevents respondent fatigue from distorting your most critical metric. Every question after it is secondary.
-
Keep the survey to 5–7 questions maximum. Surveys longer than 7 questions cause completion rates to drop sharply. Brevity protects your response quality.
-
Add a follow-up for the main benefit. Ask: “What is the main benefit you get from this product?” This reveals what your best users actually value, which often differs from what you built.
-
Ask about the alternative. “What would you use if this product no longer existed?” This identifies your real competition and shows how replaceable you are.
-
Include a segmentation question. Ask users to self-identify by role, use case, or company size. This data becomes critical during analysis.
-
Close with an open improvement question. “How could we improve this product for you?” This surfaces friction points and feature gaps directly from your most engaged users.
-
Survey only active, qualified users. Only users who have experienced the core product value at least twice in recent weeks should be included. New signups and inactive accounts produce noisy, diluted results.
Pro Tip: Run your PMF survey on a monthly or quarterly cadence with consistent user cohorts. PMF is a dynamic relationship, not a one-time milestone. Tracking score trends over time tells you whether your product is moving toward or away from fit.
Timing matters as much as question design. Sending the survey too early, before users have experienced real value, produces artificially low scores. Sending it too late, after users have churned, misses the people whose opinions matter most. The right window is after a user has completed a meaningful workflow at least twice.
How to interpret your product-market fit survey results
Raw scores are only the starting point. The real insight comes from segmenting responses and combining them with behavioral data. A single aggregate score can mask a strong-fit segment buried inside a weak overall result.
Interpreting scores by range:
- Below 25%: The product does not yet solve a critical need for most users. Pivoting or significantly repositioning is the right response before any growth investment.
- 25–40%: Emerging fit exists. The product has real value for a subset of users, but the value proposition needs sharpening or the audience needs narrowing.
- Above 40%: Strong fit confirmed. The focus shifts to retention, referral, and scaling the channels that brought these users in.
Segmenting responses by user type, tenure, and use case is where the real analysis begins. An overall score of 28% might contain a segment of power users scoring 55%. That segment is your ideal customer profile. Building for them, and acquiring more of them, is the correct response to that data.
Open-ended responses from “very disappointed” users are the most valuable qualitative asset in the survey. Qualitative text responses from this group reveal the core benefits users rely on, the objections that hold others back, and the specific improvements that would increase dependency. Read every one of them.
Cross-referencing survey scores with behavioral metrics sharpens your interpretation further. Month-3 retention above 40% strongly supports a PMF survey score. If your survey score is above 40% but month-3 retention is below that threshold, the survey result is likely inflated by optimistic responses rather than genuine dependency.
| PMF Score | Retention Signal | Recommended Action |
|---|---|---|
| Above 40% | Month-3 retention above 40% | Scale acquisition and retention programs |
| 25–40% | Month-3 retention 25–40% | Narrow ICP, strengthen onboarding |
| Below 25% | Month-3 retention below 25% | Reassess core value proposition |
High-expectation customers (HXC) are the users who answer “very disappointed” and also provide detailed open-ended feedback. These users define what your product must do to earn loyalty. Prioritizing roadmap items that serve HXCs directly increases the probability of moving your PMF score upward.
Practical steps to act on your survey feedback
Survey data without a response plan is wasted effort. The action you take depends directly on where your score falls, and the qualitative data tells you how to get there.
-
If your score is above 40%, focus on retention and referral. Identify the acquisition channels that brought in your “very disappointed” users and invest more in them. Build features that deepen the dependency those users already feel. Avoid adding features that dilute the core use case.
-
If your score is between 25% and 40%, narrow your ideal customer profile. Use segmentation data to identify which user type scores highest and reorient your messaging and onboarding around that group. Strengthening the value proposition for a specific segment is more effective than trying to improve the score across all users simultaneously. For SaaS founders, the vertical SaaS vs. internal tool distinction often clarifies which segment to prioritize.
-
If your score is below 25%, stop scaling. Reassess whether you are solving a critical problem or a convenient one. PMF failure often stems from solving non-critical needs. Use qualitative responses to identify whether a pivot in audience, use case, or core functionality could move the needle.
-
Fix onboarding friction using open-ended responses. Users who answer “somewhat disappointed” often like the product but have not yet experienced its full value. Their open-ended feedback typically reveals onboarding gaps. Fixing these gaps converts borderline users into “very disappointed” advocates.
-
Run iterative survey cycles. Survey, analyze, act, and re-survey on a quarterly cadence. Track your PMF score as a trend line, not a single data point. A score moving from 22% to 31% over two quarters signals real progress even if you have not crossed 40% yet.
Pro Tip: When acting on qualitative feedback, weight the responses from “very disappointed” users more heavily than all other groups combined. These users describe the product at its best. Their language should directly inform your positioning, onboarding copy, and feature roadmap. For founders building toward an MVP product design milestone, this feedback is the clearest signal available.
Measuring product-market fit for B2B products requires one additional layer. B2B users often answer on behalf of their organization, not themselves personally. Ask a follow-up question about team-wide usage to separate individual preference from organizational dependency. A product that one power user loves but the broader team ignores has weak organizational fit regardless of the individual score. Tracking operational efficiency metrics alongside your PMF score gives B2B founders a fuller picture of whether the product is genuinely embedded in workflows.
Key Takeaways
A product-market fit survey measures customer dependency, not satisfaction, and the Sean Ellis 40% benchmark remains the most reliable threshold for determining whether a product is ready to scale.
| Point | Details |
|---|---|
| Use the 40% benchmark | Products scoring 40%+ “very disappointed” responses demonstrate strong product-market fit. |
| Keep surveys short | Limit surveys to 5–7 questions and lead with the core PMF question to protect completion rates. |
| Segment before concluding | Aggregate scores can hide strong-fit segments; always break results down by user type and use case. |
| Combine data sources | Cross-reference PMF scores with month-3 retention to validate or challenge survey results. |
| Act on qualitative responses | Open-ended answers from “very disappointed” users directly inform roadmap and onboarding decisions. |
Why most founders misread their PMF survey scores
The most common mistake I see founders make is treating the PMF score as a pass-or-fail grade rather than a diagnostic tool. A score of 32% is not a failure. It is a map. It tells you that a meaningful portion of your users genuinely need the product, and your job is to find more of them and build more of what they value.
The second mistake is surveying too broadly. Founders include trial users, inactive accounts, and people who signed up out of curiosity. Those responses drag the score down and obscure the signal from your real users. The discipline of filtering for active, experienced users is not optional. It is the difference between useful data and misleading noise.
I have also seen founders treat a score above 40% as permission to stop measuring. PMF shifts as markets change, competitors enter, and your product evolves. A quarterly survey cadence is not bureaucracy. It is how you catch drift before it becomes a crisis.
The qualitative data is consistently underused. Founders look at the score, feel relieved or worried, and move on. The open-ended responses from your “very disappointed” users contain the clearest product brief you will ever receive. They tell you exactly what to protect, what to fix, and how to talk about the product. Reading them carefully is one of the highest-leverage activities in early-stage product management.
— William
How Wallandfifth helps founders validate and build
Founders who have run a PMF survey and know what their users need still face the harder problem: building it well. Wallandfifth works with early-stage founders and product teams to turn validated feedback into designed, functional products.

The work covers product strategy, UX/UI design, and full build execution, from wireframes through to App Store submission. If your survey results point to a specific feature gap, onboarding problem, or need to rebuild around a narrower customer profile, that is exactly the kind of brief we work from. Wallandfifth’s product design for startups service is built for founders who have done the validation work and need a senior team to execute it properly. If you are earlier in the process, the MVP product development service covers the full path from concept to launched product.
FAQ
What is a product-market fit survey?
A product-market fit survey measures how indispensable your product is to users by asking how disappointed they would be if it no longer existed. The Sean Ellis method scores PMF based on the percentage of users who answer “very disappointed.”
What does the 40% rule mean in PMF surveys?
Products where 40% or more of active users say they would be “very disappointed” without it are considered to have strong product-market fit. Scores below 25% indicate weak fit requiring significant product or positioning changes.
Who should you survey for product-market fit?
Survey only active users who have experienced the core product value at least twice in recent weeks. Including inactive or new users dilutes results and produces misleading scores.
How often should you run a PMF survey?
Best practice is to run PMF surveys at least quarterly with consistent user cohorts. This cadence lets you track score trends over time and catch changes in fit before they affect retention.
Can a PMF score above 40% mean you are ready to scale?
A score above 40% is a strong signal but not a standalone green light. Integrate it with month-3 retention rates, churn data, and acquisition costs before committing to a scaling strategy.
Recommended
- Product Design for Founders — Commercial Logic Before Visual Craft | Wall & Fifth
- Launch Strategy for Founders — Enter the Market With the Right Foundation | Wall & Fifth
- Vertical SaaS vs Internal Tool: Which Are You Actually Building? | Wall & Fifth | Wall & Fifth
- Wall & Fifth for Startups | Founder-Led Digital Partner | Wall & Fifth